NAAIM Speaks is monthly newsletter containing market insights and analysis from NAAIM member firms. This newsletter is designed to provide a plethora of market analysis, indicators, some occasional humor, as well as a summary of NAAIM’s proprietary Dynamic Asset Allocation Model and Managers Exposure Index. The report is for informational uses only and is not to be construed as investment advice.
A Long Slog
By: David Moenning, Heritage Capital Research
Published: 09.19.22

About a month ago – you know, back when stocks were making “higher highs,” new buy signals were flashing, and everybody was thinking that we’d seen the worst of the bear market – I remarked privately to a couple colleagues that while things were going well at the time, my biggest worry was that the battle against inflation, and in turn that between the bulls and bears on Wall Street, wouldn’t end quickly. No, I feared that this might turn into a long slog…
Stocks Cranky as 2-Yr Soars (Again)
By: Paul Schatz, Heritage Capital LLC
Published: 09.19.22

On Wednesday I shared that huge, outsized plunges like we saw on Tuesday do not typically mark the final low. We didn’t have to wait long as stocks fell again on Thursday below Tuesday’s low and Friday’s open looks to be another very weak one. I mentioned how important the U.S. dollar was to the markets and how seeing it peak was essential for stocks and bonds to form a low…
Just a Bear Market Rally
By: Ryan C. Redfern ShadowRidge Asset Management
Published: 08.26.22

While July was starting to feel like things might be turning around, August reminded us that it may have only been a “bear market rally” and there could be more downside ahead. Remember, tis the season for more downside. “September is when leaves and stocks tend to fall; on Wall Street it’s the worst month of all.” –Stock Trader’s Almanac.
The Message From the NAAIM Indicator Wall
By: National Association of Active Investment Managers
Updated: 07.01.2022
The NAAIM Indicator Wall provides a weekly update to a robust array of stock market indicators. The “wall” includes readings and explanations of indicators and/or models in the areas of price/trend, momentum, key price levels, overbought/sold readings, sentiment, monetary, economic, inflation, and market cycles.
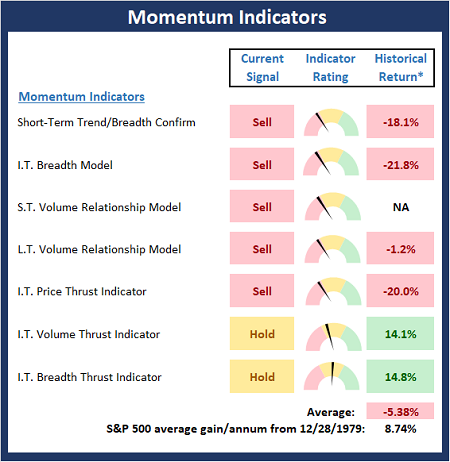
This time, we’re featuring the Momentum Board , which is designed to show if there is any “oomph” behind the current move.
Note: The Indicator Wall is a benefit provided to NAAIM Members and is password protected. To obtain a temporary password, contact NAAIM at 888-261-0787.
Bears Large and In Charge
By: Rob Bernstein, RGB Capital Group
Published: 09.19.22

The bear market that started in early 2022 remains intact and most asset classes are in a decline. The early summer rally in
risk assets (i.e. stocks and junk bonds) was nothing more than a strong rally within the context of a longer-term bear market.
The months of September and October tend to be a seasonally weak period for the markets and this year, at least so far,
doesn’t look to be much different. So…
Hanging By a Thread
By: Craig Thompson, President Asset Solutions
Published: 09.05.22

At the beginning of each month, I review monthly charts to get a longer-term perspective of markets. Then I compare that analysis to what is occurring in shorter-term charts. In summary, momentum is bearish on both a long-term and short-term basis. And the most recent candle in each time frame is bearish suggesting odds are elevated that we could see more downside pressure in stocks…
The NAAIM Dynamic Allocation Model
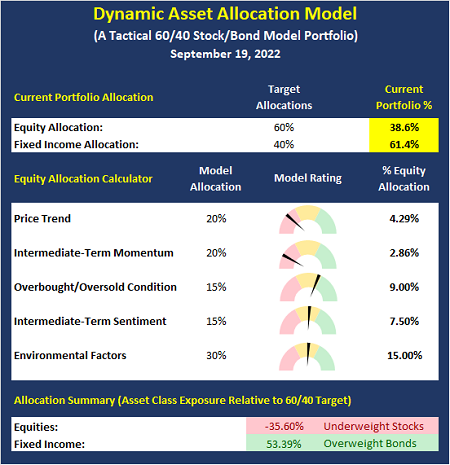
Designed to be a value-add benefit to membership, NAAIM offers a Dynamic Asset Allocation Model based on the NAAIM Indicator Wall of indicators and models. The overall objective of the model portfolio is to dynamically adapt to changing market environments and to keep equity exposure in line with conditions. The model targets a normalized allocation of 60% stocks and 40% Bonds.
Here is this week’s model allocation:
The model has been run live on the NAAIM website for several years and has demonstrated the ability to reduce exposure to market risk during negative environments such as those seen in 2015-16 and 2018.
More on the Dynamic Allocation Model and Historical Readings
The NAAIM Dynamic Allocation Model is for illustrative and informational purposes only, and does not in any way represent an endorsement by NAAIM or an investment recommendation.
When It Just Ain’t So
By: Sam and Bo Bills Bills Asset Management
Published: 09.16.22

Last week we noted, “Upside from here is likely limited but It is possible we could test the next resistance level at the 4130 level. We continue to believe that any rallies should be sold to bring your portfolios back to your risk tolerance. The bear market will eventually end but we suspect more pain is ahead before then.” Well, the markets did make a run at 4130 getting to 4119 before
turning back down. And turn down it did!
Please Don’t Fight the Fed/Fundamentals!
By: Dexter P. Lyons Issachar Fund
Published: 09.16.22

In a Bear Market, almost all stocks eventually succumb to the selling pressure; therefore, I chose to sit patiently on my hands. However, I am stalking junk bonds and emerging markets on the short side. I have seen bear markets like this in my 32 years of actively managing risk, and the uglier it gets on the downside, the better the opportunity after the market bottoms. We need to find a bottom, but the Fed/Fundamentals may not be favorable until the market senses the Fed is done raising rates…
The NAAIM Member Exposure Index
The NAAIM Exposure Index represents the average exposure to US Equity markets as reported by our members in the organization’s weekly survey. Note that many NAAIM members are risk managers and tend to reduce exposure to the markets during high risk environments.
NOT INVESTMENT ADVICE. The analysis and information in this report and on our website is for informational purposes only. No part of the material presented in this report or on our websites is intended as an investment recommendation or investment advice. Neither the information nor any opinion expressed nor any Portfolio constitutes a solicitation to purchase or sell securities or any investment program. The opinions and forecasts expressed are those of the editors and may not actually come to pass. The opinions and viewpoints regarding the future of the markets should not be construed as recommendations of any specific security nor specific investment advice. Investors should always consult an investment professional before making any investment.
Tags: NAAIM, NAAIM Speaks, Stocks market analysis, Stock Market Analysis, Stock market, stock market indicators, David Moenning, Paul Schatz, Rob Bernstein, Ryan Redfern, Sam Bills, Bo Bills, Dexter Lyons, Craig Thompson, NAAIM Exposure Index, NAAIM Dynamic Allocation Model


