NAAIM Speaks is monthly newsletter containing market insights and analysis from NAAIM member firms. This newsletter is designed to provide a plethora of market analysis, indicators, some occasional humor, as well as a summary of NAAIM’s proprietary Dynamic Asset Allocation Model and Managers Exposure Index. The report is for informational uses only and is not to be construed as investment advice.
Stronger For (How Much) Longer?
By: David Moenning, Heritage Capital Research
Published: 5.7.24

By now, everybody on the planet knows that “higher for longer” remains the Fed’s primary battle cry. This is due in large part to the fact that the US economy has been much stronger for longer than almost anyone could have imagined. The question though is how much longer the economy can remain robust…
Goldilocks Is In The House
By: Paul Schatz, Heritage Capital LLC
Published: 4.3.24

A new week begins after last week ended with a bang. If Apple’s earnings and epic share buyback weren’t enough, the jobs report on Friday gave a Goldilocks gift of not too hot and not too cold. 175,000 new jobs were created versus the 240,000 anticipated. While the number of jobs created was below expectations it was still a very solid number…
Garden Variety Pullback?
By: Ryan C. Redfern ShadowRidge Asset Management
Published: 4.26.24

We are finally seeing the small pull-back or “correction” in the broad markets that we had been expecting since the year began. So far, the S&P 500 has had a fairly classic 5% pullback that started right as the month began and lasted until the 19th. What has to be considered now is: if that 5% pullback is all we’re going to get? or will the index, at some point, re-test that low over the next few days or even weeks?
The Message From the NAAIM Indicator Wall
By: National Association of Active Investment Managers
The NAAIM Indicator Wall provides a weekly update to a robust array of stock market indicators. The “wall” includes readings and explanations of indicators and/or models in the areas of price/trend, momentum, key price levels, overbought/sold readings, sentiment, monetary, economic, inflation, and market cycles.
This time, we’re featuring the Primary Cycle Board , which is designed to identify the state of the primary cycle of the stock market
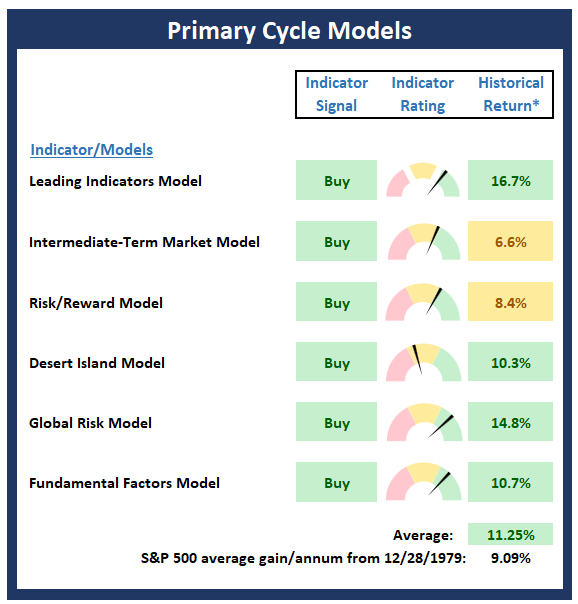
Note: The Indicator Wall is a benefit provided to NAAIM Members and is password protected. To obtain a temporary password, contact NAAIM at 888-261-0787.
Sell in May?
By: Rob Bernstein, RGB Capital Group
Published: 5.6.24

The market saw a textbook 5% correction into the middle of April and is now working its way back into an uptrend. And
while normally we are in the “Sell in May and Go Away” period of the year, that tends to not be the case in an election year.
Of course, we’d like to see more confirmation before getting too aggressive as there remains the potential to re-test the
April lows.
Is The Pullback Over?
By: Craig Thompson, President Asset Solutions
Published: 5.5.24

The market is at a short-term inflection point. A strong move above resistance combined with a break higher in OBV would signal the market pullback has run its course. Conversely, if the index declines from here, it would suggest continued market weakness…
The NAAIM Dynamic Allocation Model
Designed to be a value-add benefit to membership, NAAIM offers a Dynamic Asset Allocation Model based on the NAAIM Indicator Wall of indicators and models. The overall objective of the model portfolio is to dynamically adapt to changing market environments and to keep equity exposure in line with conditions. The model targets a normalized allocation of 60% stocks and 40% Bonds.
Here is this week’s model allocation:
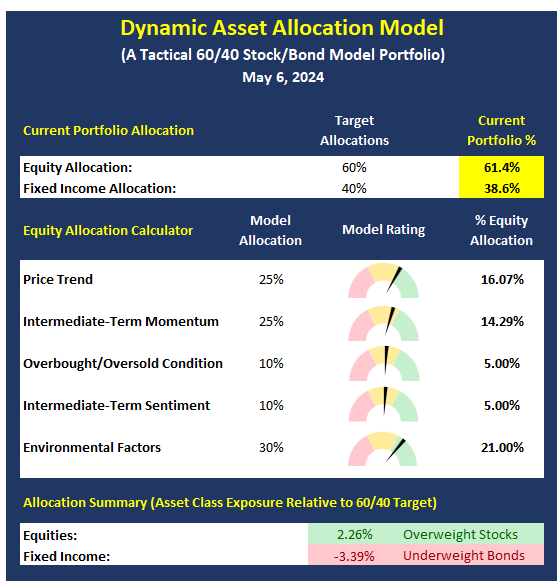
The model has been run live on the NAAIM website for several years and has demonstrated the ability to reduce exposure to market risk during negative environments such as those seen in 2015-16 and 2018.
More on the Dynamic Allocation Model and Historical Readings
The NAAIM Dynamic Allocation Model is for illustrative and informational purposes only, and does not in any way represent an endorsement by NAAIM or an investment recommendation.
Looks Like Sunnier Skies
By: Bo Bills Bills Asset Management
Published: 5.3.24

As expected, the Fed did nothing on the interest rate front this week. However, the Fed noted that it was slowing the runoff
of its balance sheet effectively increasing liquidity in the markets. The result of the Fed balance sheet action has some of the
same effects as an interest rate cut and was viewed as dovish by the markets…
Thoughts on Inflation
By: Will Hepburn ShadowRidge Asset Management
Published: 4.26.24

If you want to try a low-risk way to play the commodities market, try Forever Stamps. I bought a boatload of them before the price rose in 2020 and my stash of cheap stamps is paying a great dividend. By July, I will be saving 32% every time I mail a letter. On the subject of inflation, there they go again…
The Two Key Risks
By: Ben Reppond Reppond Investments
Published: 4.24.24

Ben Reppond’s latest video explains the two key risks in the stock market today…
We Remain Optimistic
By: Asher Rogovy Magnifina
Published: 4.10.24

Looking ahead, we’re optimistic about the market. Just because the Fed sees the possibility for a slowdown, doesn’t mean it would occur soon. Additionally, there are some potential supports for the economy, which might help achieve a soft landing. These include pent-up housing demand and a wave of productivity gains from new technologies. There are of course risks to this scenario (including geopolitical risks), and we will continue to monitor new developments…
The NAAIM Member Exposure Index
The NAAIM Exposure Index represents the average exposure to US Equity markets as reported by our members in the organization’s weekly survey. Note that many NAAIM members are risk managers and tend to reduce exposure to the markets during high risk environments.
Click To See the Current Exposure Index
NOT INVESTMENT ADVICE. The analysis and information in this report and on our website is for informational purposes only. No part of the material presented in this report or on our websites is intended as an investment recommendation or investment advice. Neither the information nor any opinion expressed nor any Portfolio constitutes a solicitation to purchase or sell securities or any investment program. The opinions and forecasts expressed are those of the editors and may not actually come to pass. The opinions and viewpoints regarding the future of the markets should not be construed as recommendations of any specific security nor specific investment advice. Investors should always consult an investment professional before making any investment.
Tags: NAAIM, NAAIM Speaks, Stock market, Stock Market Analysis, stock market, David Moenning, Heritage Capital Research, Paul Schatz, Heritage Capital LLC, Rob Bernstein, RGB Capital Group, Ryan Redfern, Shadowridge Asset Management, Sam Bills, Bo Bills, Bills Asset Management, Dexter Lyons, Issachar Fund, Jim Lee, Stratfi, Craig Thompson, Asset Solutions, William Hepburn, Asher Rogovy, Magnifina, Ben Reppond, Reppond Investments, NAAIM Exposure Index, NAAIM Dynamic Allocation Model