NAAIM Speaks is newsletter containing market insights and analysis from NAAIM member firms. This newsletter is designed to provide a plethora of market analysis, indicators, some occasional humor, as well as a summary of NAAIM’s proprietary Dynamic Asset Allocation Model and Managers Exposure Index. The report is for informational uses only and is not to be construed as investment advice.
A Bad News Panic
By: David Moenning, Heritage Capital Research
Published: 3.8.25

The stock market is currently experiencing a corrective/consolidation phase with bearish narratives having dominated daily trading since the S&P 500 hit its most recent all-time high on February 19th. The question of the day thus becomes, why has the market’s tone suddenly changed? I believe the answer can be summed up with one word…
Bulls Need Less Momentum
By: Paul Schatz, Heritage Capital LLC
Published: 3.10.25

The markets continue to be more challenging to maneuver. Friday was the third time and second Friday during the pullback where stocks sold off sharply and then rallied to close well. The previous two times, the bears came right back to work the next day to thwart the bulls. The bulls will absolutely need to break that behavior for any kind of low to form.
February Sticks To Script
By: Ryan C. Redfern ShadowRidge Asset Management
Published: 2.28.25

After a positive January that recovered December losses, we’re now seeing another market pull-back that has the S&P 500 Index back below even for the month of February. But so far, this is all just in-line with what typical seasonality suggests. Historically, the second half of February tends to be a rough patch. And specifically, the last week of February tends to have a low probability of gains. So what we are seeing right now is nearly textbook perfect, as far as seasonality suggests…
The Message From the NAAIM Indicator Wall
By: National Association of Active Investment Managers
The NAAIM Indicator Wall provides a weekly update to a robust array of stock market indicators. The “wall” includes readings and explanations of indicators and/or models in the areas of price/trend, momentum, key price levels, overbought/sold readings, sentiment, monetary, economic, inflation, and market cycles.
This time, we’re featuring the Fundamentals Board , which is a summary of key external factors that have been known to drive stock prices on a long-term basis.

Note: The Indicator Wall is a benefit provided to NAAIM Members and is password protected. To obtain a temporary password, contact NAAIM at 888-261-0787.
All About Tariffs, But…
By: Rob Bernstein, RGB Capital Group
Published: 3.10.25

The major stock market indexes remain on edge due to uncertainties around tariffs (among other political events). This is
understandable, as the market doesn’t like uncertainty. However, as long as the major trend of the stock market remains
positive..
Out on a Ledge
By: Craig Thompson, President Asset Solutions
Published: 3.1.25

While the market remains at a technical inflection point, recent price action has been decisively bearish. The failure to break out of the top of its trading range and the strong downside momentum suggest that the risk of further declines is rising. Additionally, market breadth has deteriorated, with key risk-on assets—such as semiconductors, small caps, and discretionary stocks—underperforming defensive sectors like consumer staples. In this month’s newsletter, we will examine three key charts that highlight the current state of the market..
The NAAIM Dynamic Allocation Model
Designed to be a value-add benefit to membership, NAAIM offers a Dynamic Asset Allocation Model based on the NAAIM Indicator Wall of indicators and models. The overall objective of the model portfolio is to dynamically adapt to changing market environments and to keep equity exposure in line with conditions. The model targets a normalized allocation of 60% stocks and 40% Bonds.
Here is this week’s model allocation:
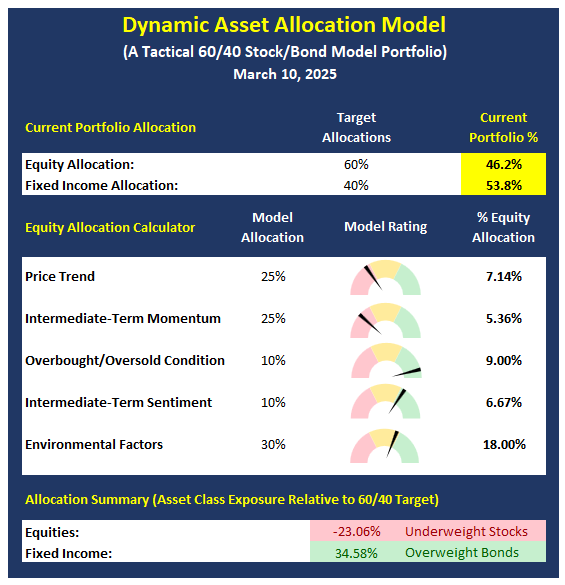
The model has been run live on the NAAIM website for several years and has demonstrated the ability to reduce exposure to market risk during negative environments such as those seen in 2015-16 and 2018.
More on the Dynamic Allocation Model and Historical Readings
The NAAIM Dynamic Allocation Model is for illustrative and informational purposes only, and does not in any way represent an endorsement by NAAIM or an investment recommendation.
Uncertainty Rules The Day
By: Bo Bills Bills Asset Management
Published: 3.7.25

Uncertainty rules the day. From the on again, off again tariffs, the on again, off again peace talks in Ukraine, the effects of the
DOGE government cuts, etc., the market is having indigestion dealing with the back and forth and the onslaught of day-to-day
new information…
The Age of Autonomous Cars Is Here
By: Will Hepburn ShadowRidge Asset Management
Published: 2.28.25

A year or so ago when I was down in “The Valley,” as we highlanders call the Phoenix metro area, I saw several Waymo driverless taxis and said to myself, “I want to try that.” I was in Scottsdale recently and was surprised at the number of Waymo cars I saw. They were everywhere! You can recognize a Waymo by their spinning gumball machine appendages front, top and back. The driverless technology has been tested in Phoenix and a few other warm weather towns and we are on the verge of widespread adoption of Autonomous Vehicles (AVs). I can imagine a time in the not-so-distant future when cars that we must drive ourselves will seem so “last century” as the kids say. So how will our lives change as this paradigm shift to AVs takes place in society?
Latest Market Insights Video
By: Ben Reppond Reppond Investments
Published: 3.11.25

Ben Reppond’s latest video reviews the status of the stock market today…
Defense and Uncertainty
By: Dexter P. Lyons Issachar Fund
Published: 3.9.25

Uncertainty is the market’s enemy, and escalating trade wars and tariffs could lead to slower growth and rising inflation—potentially resulting in stagflation. Tariffs will likely drive up costs across all goods and services, further fueling inflation expectations, which could ultimately hurt corporate earnings. Playing defense may be the best strategy to minimize losses in a bear market…
The NAAIM Member Exposure Index
The NAAIM Exposure Index represents the average exposure to US Equity markets as reported by our members in the organization’s weekly survey. Note that many NAAIM members are risk managers and tend to reduce exposure to the markets during high risk environments.
Click To See the Current Exposure Index
NOT INVESTMENT ADVICE. The analysis and information in this report and on our website is for informational purposes only. No part of the material presented in this report or on our websites is intended as an investment recommendation or investment advice. Neither the information nor any opinion expressed nor any Portfolio constitutes a solicitation to purchase or sell securities or any investment program. The opinions and forecasts expressed are those of the editors and may not actually come to pass. The opinions and viewpoints regarding the future of the markets should not be construed as recommendations of any specific security nor specific investment advice. Investors should always consult an investment professional before making any investment.
Tags: NAAIM, NAAIM Speaks, Stock market, Stock Market Analysis, stock market, David Moenning, Heritage Capital Research, Paul Schatz, Heritage Capital LLC, Rob Bernstein, RGB Capital Group, Ryan Redfern, Shadowridge Asset Management, Sam Bills, Bo Bills, Bills Asset Management, Dexter Lyons, Issachar Fund, Jim Lee, Stratfi, Craig Thompson, Asset Solutions, William Hepburn, Asher Rogovy, Magnifina, Ben Reppond, Reppond Investments, NAAIM Exposure Index, NAAIM Dynamic Allocation Model