NAAIM Speaks is monthly newsletter containing market insights and analysis from NAAIM member firms. This newsletter is designed to provide a plethora of market analysis, indicators, some occasional humor, as well as a summary of NAAIM’s proprietary Dynamic Asset Allocation Model and Managers Exposure Index. The report is for informational uses only and is not to be construed as investment advice.
Can Anything Else Go Wrong?
By: David Moenning, Heritage Capital Research
Published: 06.06.22

To be sure, it’s been a rough go for stock market investors and many analysts contend (yours truly included) that we’ve got a bear martket on our hands. But after COVID, inflation, the Fed’s pivot, supply chain issues, an unfathomable war in Europe, a surge in interest rates, and slowing growth, my question is, what else can go wrong?
A Bull Market in Bearishness
By: Paul Schatz, Heritage Capital LLC
Published: 06.06.22

It’s amazing how many articles I see and Google searches being made about recessions and bear markets. Since the 2008 financial crisis, investors have typically pivoted very quickly to being negative when headlines were dark. And since 2009 we have not had any long-lasting stock market declines. When I get questioned about the comparison between now and the Dotcom Bubble, there are many enormous differences, but none bigger than the lengthy period it took for investors to become bearish….
Big Picture Looking Ugly
By: Ryan C. Redfern ShadowRidge Asset Management
Published: 05.27.22

The big picture still isn’t looking great for both the stock market and the economy. The Federal Reserve raised interest rates by 0.50% on May 4th which was considered by many to be a more aggressive move than the usual 0.25% increase. But what comes next is of more interest to us. We think it is possible that the next rate increase could be as high as 0.75% (instead of the 0.50% that is expected by most of the Wall Street crowd). In either case, we’re curious how that is interpreted by investors: will it be seen as a time to buy, or does it lead to selling and the next leg down in the market?
Are We There Yet?
By: James Lee StratFi
Published: 05.27.22

“It has been a terrible, horrible, no good, very bad” year for investors. Let’s call it a “triple bear” market. There is no hiding from it – everyone is looking for a tree to climb or a cave to hide in. Fortunately, stocks don’t go down forever. Futurists say that “A trend is a trend until it bends or it ends.” The question on everybody’s mind is, “How long are these losses going to last?
The Message From the NAAIM Indicator Wall
By: National Association of Active Investment Managers
Updated: 05.02.22
The NAAIM Indicator Wall provides a weekly update to a robust array of stock market indicators. The “wall” includes readings and explanations of indicators and/or models in the areas of price/trend, momentum, key price levels, overbought/sold readings, sentiment, monetary, economic, inflation, and market cycles.
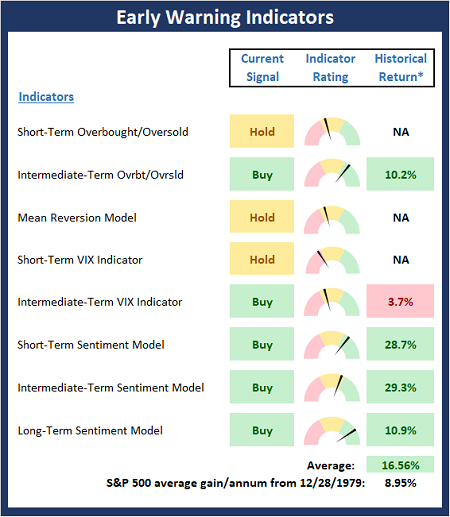
This time, we’re featuring the Early Warning Board , which is designed to suggest when the market may be ripe for a reversal on a short-term basis.
Note: The Indicator Wall is a benefit provided to NAAIM Members and is password protected. To obtain a temporary password, contact NAAIM at 888-261-0787.
High Risk Environment
By: Rob Bernstein, RGB Capital Group
Published: 06.06.22

Despite the impressive rally over the last two weeks, there is no indication that the bear market decline that started earlier
this year is over. The series of declining peaks in the equity indices reflect a down trending market and this is confirmed by
the junk bond index. The factors driving the current decline, including supply chain issues, high inflation and a Fed set on
tightening monetary policy, continue to create a high-risk market environment…
Don’t Get Your Hopes Up
By: Craig Thompson, President Asset Solutions
Published: 06.06.22

Easy money policies by the Fed and excessive fiscal spending have placed the economy and thus markets in a position of weakness. Inflation is raging and the Fed is trying to reign it in as the economy is showing signs of slowing. The net result is that markets are likely to be more volatile and the risk of prolonged market declines elevated. Passive investment strategies that worked well over the past bull market run are likely to underperform going forward…
The NAAIM Dynamic Allocation Model
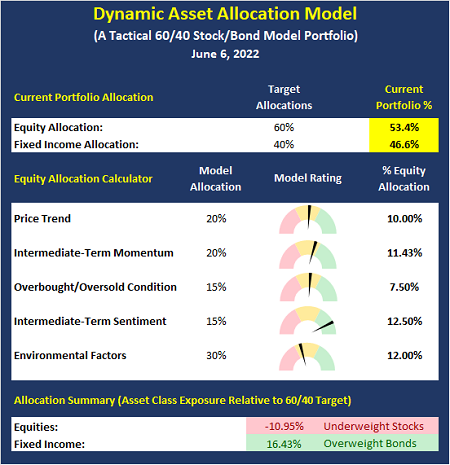
Designed to be a value-add benefit to membership, NAAIM offers a Dynamic Asset Allocation Model based on the NAAIM Indicator Wall of indicators and models. The overall objective of the model portfolio is to dynamically adapt to changing market environments and to keep equity exposure in line with conditions. The model targets a normalized allocation of 60% stocks and 40% Bonds.
Here is this week’s model allocation:
The model has been run live on the NAAIM website for several years and has demonstrated the ability to reduce exposure to market risk during negative environments such as those seen in 2015-16 and 2018.
More on the Dynamic Allocation Model and Historical Readings
The NAAIM Dynamic Allocation Model is for illustrative and informational purposes only, and does not in any way represent an endorsement by NAAIM or an investment recommendation.
Breezy With A Chance of Hurricane
By: Sam and Bo Bills Bills Asset Management
Published: 06.03.22

Well, that didn’t last long! Last week marked the
first up week in 2 months. But, selling returned this
week as the bellwether S&P looks to finish the week
down. As of this writing, the index is down 1% for
the week. Considering the carnage of prior weeks, a
measly 1% doesn’t feel so bad. But according to Jamie Dimon, the forecast calls for…
Energy Is Hot!
By: Dexter P. Lyons Issachar Fund
Published: 06.06.22

Biden has not changed his “anti-fossil fuel” position to increase oil production in the US, so I expect oil prices to continue rising, producing higher profits for the energy sector. The market is trying to digest higher gas prices, higher interest rates, supply chain problems, and the Fed’s response to these inflationary issues…
The NAAIM Member Exposure Index
The NAAIM Exposure Index represents the average exposure to US Equity markets as reported by our members in the organization’s weekly survey. Note that many NAAIM members are risk managers and tend to reduce exposure to the markets during high risk environments.
NOT INVESTMENT ADVICE. The analysis and information in this report and on our website is for informational purposes only. No part of the material presented in this report or on our websites is intended as an investment recommendation or investment advice. Neither the information nor any opinion expressed nor any Portfolio constitutes a solicitation to purchase or sell securities or any investment program. The opinions and forecasts expressed are those of the editors and may not actually come to pass. The opinions and viewpoints regarding the future of the markets should not be construed as recommendations of any specific security nor specific investment advice. Investors should always consult an investment professional before making any investment.
Tags: NAAIM, NAAIM Speaks, Stocks market analysis, Stock Market Analysis, Stock market, stock market indicators, David Moenning, Paul Schatz, Rob Bernstein, Ryan Redfern, James Lee, Sam Bills, Bo Bills, Dexter Lyons, Craig Thompson, NAAIM Exposure Index, NAAIM Dynamic Allocation Model


