NAAIM Speaks is monthly newsletter containing market insights and analysis from NAAIM member firms. This newsletter is designed to provide a plethora of market analysis, indicators, some occasional humor, as well as a summary of NAAIM’s proprietary Dynamic Asset Allocation Model and Managers Exposure Index. The report is for informational uses only and is not to be construed as investment advice.
Making It Official
By: David Moenning, Heritage Capital Research
Published: 1.22.24

It took a while (as in over 500 days), but the S&P 500 and DJIA finally managed to close at fresh all-time highs on Friday. While the bears may argue that the so-called “breakout” must prove itself in the coming days/weeks (Martin Pring was famous for suggesting an additional 3% was needed as confirmation of key breakouts), analysts who study the history of these things suggest a new bull market is now officially underway.
Not All Rainbows and Unicorns
By: Paul Schatz, Heritage Capital LLC
Published: 1.22.24

The markets start the week at all-time highs. Let that sink in for a while. While the bears have doubled and tripled down this year with the nonsensical, BUT BUT BUTs, the bulls have gone about their business after the brief pullback. The Dow Industrials, S&P 500 and NASDAQ 100 are all seeing blue skies right now. The S&P 400 and Russell 2000 still have some work to do although I do believe the former will see all-time highs later this year. Lest you think everything is rainbows and unicorns, let me be clear; it’s not….
What A Year It Was
By: Ryan C. Redfern ShadowRidge Asset Management
Published: 12.29.23

We’re now looking at the end of 2023 and wow, what a year it was. Until the last couple of months, so much of the market had just gone nowhere. But the November run up (which was seasonally expected) and the continued run up in December (not as seasonally expected) gave the laggards a chance to catch up. And they absolutely have! But what’s next? We think it would have been more ideal to have at least some sort of pull-back in the market in early December to set us up for a rally into the year-end. Seasonality suggests…
The Message From the NAAIM Indicator Wall
By: National Association of Active Investment Managers
The NAAIM Indicator Wall provides a weekly update to a robust array of stock market indicators. The “wall” includes readings and explanations of indicators and/or models in the areas of price/trend, momentum, key price levels, overbought/sold readings, sentiment, monetary, economic, inflation, and market cycles.
This time, we’re featuring the Primary Cycle Board , which is designed to identify the state of the primary cycle of the stock market.
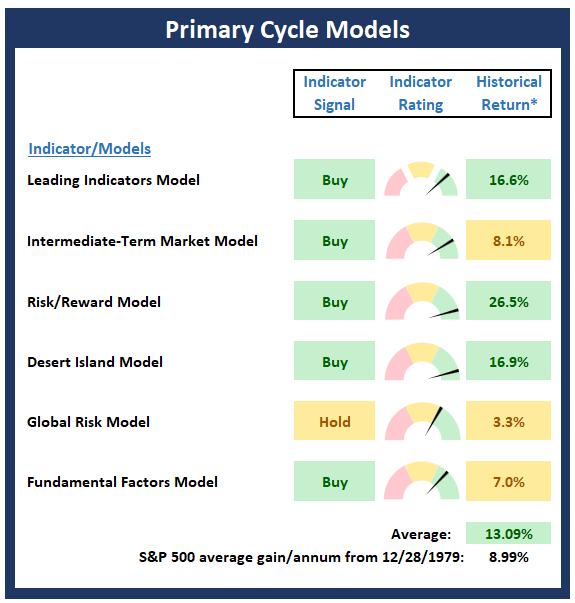
Note: The Indicator Wall is a benefit provided to NAAIM Members and is password protected. To obtain a temporary password, contact NAAIM at 888-261-0787.
Further To Go
By: Rob Bernstein, RGB Capital Group
Published: 1.22.24

Over the past week the S&P 500 Index (large-cap stocks) remained confined to the trading range that I identified in last week’s note until Friday, when it surged through the top of the range (R1). Moving sideways for a period of time is a healthy way for the market to digest the strong gains during the last two months of 2023 and the upside breakout on Friday was an early indication that the uptrend in the S&P 500 Index has further to go…
Breadth Thrust!
By: Craig Thompson, President Asset Solutions
Published: 1.2.24

When the broader stock market makes a strong move lower and subsequently advances strongly within a short period, it is called a breadth thrust. This strong move higher runs counter to the previous weaker counter trend moves higher and signals the start of a new bull market. Numerous breadth indicators can measure this phenomenon. The most popular is the Breadth Thrust Indicator (see chart below) which is commonly known as the Zweig Breadth Indicator. This indicator is based on the percentage of advancing stocks on the NYSE…
The NAAIM Dynamic Allocation Model
Designed to be a value-add benefit to membership, NAAIM offers a Dynamic Asset Allocation Model based on the NAAIM Indicator Wall of indicators and models. The overall objective of the model portfolio is to dynamically adapt to changing market environments and to keep equity exposure in line with conditions. The model targets a normalized allocation of 60% stocks and 40% Bonds.
Here is this week’s model allocation:
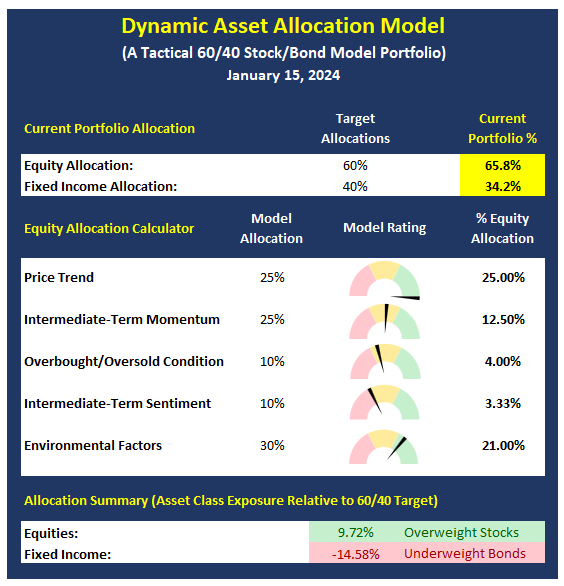
The model has been run live on the NAAIM website for several years and has demonstrated the ability to reduce exposure to market risk during negative environments such as those seen in 2015-16 and 2018.
More on the Dynamic Allocation Model and Historical Readings
The NAAIM Dynamic Allocation Model is for illustrative and informational purposes only, and does not in any way represent an endorsement by NAAIM or an investment recommendation.
Return of the Seven
By: Bo Bills Bills Asset Management
Published: 1.19.24

The last two weeks of earnings have been dominated by both the big and regional banks. The results have been mixed at
best and nothing coming out of earnings has led to any real sustainable moves in the markets. The big story so far in 2024
has been the renewed dominance of the large cap tech companies. For 2023, the magnificent 7 dominated returns for the
vast majority of the year. That only began to shift in October. We may be seeing the early signs of that dominance resuming
again in early 2024…
The NAAIM Member Exposure Index
The NAAIM Exposure Index represents the average exposure to US Equity markets as reported by our members in the organization’s weekly survey. Note that many NAAIM members are risk managers and tend to reduce exposure to the markets during high risk environments.
Click To See the Current Exposure Index
NOT INVESTMENT ADVICE. The analysis and information in this report and on our website is for informational purposes only. No part of the material presented in this report or on our websites is intended as an investment recommendation or investment advice. Neither the information nor any opinion expressed nor any Portfolio constitutes a solicitation to purchase or sell securities or any investment program. The opinions and forecasts expressed are those of the editors and may not actually come to pass. The opinions and viewpoints regarding the future of the markets should not be construed as recommendations of any specific security nor specific investment advice. Investors should always consult an investment professional before making any investment.
Tags: NAAIM, NAAIM Speaks, Stocks market analysis, Stock Market Analysis, Stock market, stock market indicators, David Moenning, Heritage Capital Research, Paul Schatz, Heritage Capital LLC, Rob Bernstein, RGB Capital Group, Ryan Redfern, Shadowridge Asset Management, Sam Bills, Bo Bills, Bills Asset Management, Dexter Lyons, Issachar Fund, Jim Lee, Stratfi, Craig Thompson, Asset Solutions, NAAIM Exposure Index, NAAIM Dynamic Allocation Model