NAAIM Speaks is monthly newsletter containing market insights and analysis from NAAIM member firms. This newsletter is designed to provide a plethora of market analysis, indicators, some occasional humor, as well as a summary of NAAIM’s proprietary Dynamic Asset Allocation Model and Managers Exposure Index. The report is for informational uses only and is not to be construed as investment advice.
The Roadmap for 2024
By: David Moenning, Heritage Capital Research
Published: 2.2.24

The drivers to the current market action are fairly straightforward and the bottom line is investors need some clarity on these topics before making major committments. So while we wait, I thought it might be a good idea to take a look at what the historical cycles look like for the rest of the coming year…
Bears Carried Out On a Stretcher
By: Paul Schatz, Heritage Capital LLC
Published: 2.5.24

The Goldilocks economy that so many predicted for 2024 seems to be a bit hotter right now. In other words, no soft landing and certainly no hard landing. In fact, right now, no landing at all. I am sorry for those who don’t own the winning stocks. It must be frustrating…
Don’t Sell in May This Year
By: Ryan C. Redfern ShadowRidge Asset Management
Published: 1.26.24

On our monthly webinar in January, I shared a chart of how each Election Year has played out – all the way back to 1928. There were 25 election years in that period! What stood out to me is an unusual pattern: the market tends to “chop” sideways for the first 6 months before having a solid, early-summer rally. This is the opposite to the “Sell in May and Go Away” mantra…
The Message From the NAAIM Indicator Wall
By: National Association of Active Investment Managers
The NAAIM Indicator Wall provides a weekly update to a robust array of stock market indicators. The “wall” includes readings and explanations of indicators and/or models in the areas of price/trend, momentum, key price levels, overbought/sold readings, sentiment, monetary, economic, inflation, and market cycles.
This time, we’re featuring the Fundamental Factors Board , which is designed to identify the state of the key external factors that have been known to drive stock prices on a long-term basis.
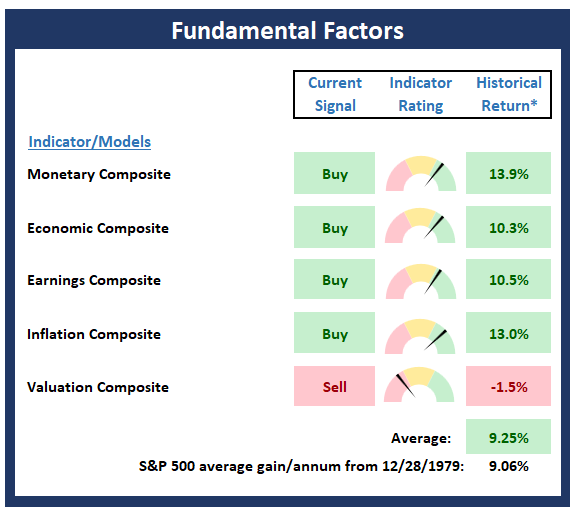
Note: The Indicator Wall is a benefit provided to NAAIM Members and is password protected. To obtain a temporary password, contact NAAIM at 888-261-0787.
Fed-Induced Volatility to Continue
By: Rob Bernstein, RGB Capital Group
Published: 2.5.24

While it is highly anticipated that the Fed will start reducing
rates this year, the exact timing is anything but certain. This
has created some volatility in the bond markets as the steady
decline in the US 10-Year Treasury Yield Index at the end of
last year has become more volatile. Rates started moving up
in early January but fell sharply towards the end of the
month. I suspect this increase in volatility will remain until
the Fed clarifies the timing of their interest rate reductions…
Bulls In Control, But…
By: Craig Thompson, President Asset Solutions
Published: 1.2.24

The stock market is in a strong bullish environment. Short-term the market is extended and nearing the upper end of its uptrending channel which is an area where it has pulled back in the past. Market breadth has deteriorated over the past month which is an additional factor that suggests we could see a minor short-term correction in stocks in the near term…
The NAAIM Dynamic Allocation Model
Designed to be a value-add benefit to membership, NAAIM offers a Dynamic Asset Allocation Model based on the NAAIM Indicator Wall of indicators and models. The overall objective of the model portfolio is to dynamically adapt to changing market environments and to keep equity exposure in line with conditions. The model targets a normalized allocation of 60% stocks and 40% Bonds.
Here is this week’s model allocation:
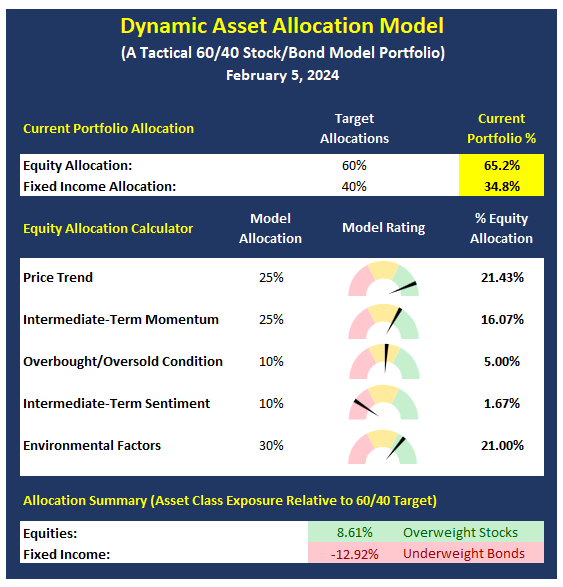
The model has been run live on the NAAIM website for several years and has demonstrated the ability to reduce exposure to market risk during negative environments such as those seen in 2015-16 and 2018.
More on the Dynamic Allocation Model and Historical Readings
The NAAIM Dynamic Allocation Model is for illustrative and informational purposes only, and does not in any way represent an endorsement by NAAIM or an investment recommendation.
Meta Millions
By: Bo Bills Bills Asset Management
Published: 2.2.24

We remain bullish and still believe pullbacks should be bought. Blowout earnings by Meta (META) and Amazon.com (AMZN) on Thursday injected the market with some much-needed support. The two are up 22% and 8% respectively for the week and have once again illustrated how instrumental the Magnificent Seven have been in maintaining this bull market run…
Fed Looking to Stick the Landing
By: Asher Rogovy, Magnifina
Published: 1.15.24

The long-expected recession still hasn’t arrived. The potential for weakness has caught the Federal Reserve’s attention, however. In their December statement, the Fed indicated that they are anticipating 3 interest rate cuts toward the end of 2024. While the economy may remain healthy today, it’s worth remembering that rate cuts occur in response to an economic slowdown. A “soft landing” is the term given to a situation where the Fed manages to avoid a recession by acting right on time. These are rare, and the previous one occurred in 1995. The Fed is commonly perceived to react too late both to inflation and recession.
The NAAIM Member Exposure Index
The NAAIM Exposure Index represents the average exposure to US Equity markets as reported by our members in the organization’s weekly survey. Note that many NAAIM members are risk managers and tend to reduce exposure to the markets during high risk environments.
Click To See the Current Exposure Index
NOT INVESTMENT ADVICE. The analysis and information in this report and on our website is for informational purposes only. No part of the material presented in this report or on our websites is intended as an investment recommendation or investment advice. Neither the information nor any opinion expressed nor any Portfolio constitutes a solicitation to purchase or sell securities or any investment program. The opinions and forecasts expressed are those of the editors and may not actually come to pass. The opinions and viewpoints regarding the future of the markets should not be construed as recommendations of any specific security nor specific investment advice. Investors should always consult an investment professional before making any investment.
Tags: NAAIM, NAAIM Speaks, Stocks market analysis, Stock Market Analysis, Stock market, stock market indicators, David Moenning, Heritage Capital Research, Paul Schatz, Heritage Capital LLC, Rob Bernstein, RGB Capital Group, Ryan Redfern, Shadowridge Asset Management, Sam Bills, Bo Bills, Bills Asset Management, Dexter Lyons, Issachar Fund, Jim Lee, Stratfi, Craig Thompson, Asset Solutions, NAAIM Exposure Index, NAAIM Dynamic Allocation Model