NAAIM Speaks is monthly newsletter containing market insights and analysis from NAAIM member firms. This newsletter is designed to provide a plethora of market analysis, indicators, some occasional humor, as well as a summary of NAAIM’s proprietary Dynamic Asset Allocation Model and Managers Exposure Index. The report is for informational uses only and is not to be construed as investment advice.
Three Reasons For Summer Rally
By: David Moenning, Heritage Capital Research
Published: 6.7.24

As the misery that was the stock market in April came to a close, investors couldn’t be blamed if they were ready to throw up their hands and embrace the old Wall Street adage, “Sell in May and go away!” (More specifically, move to cash on April 30 and return on November 1.) After all, the market had just given back a healthy chunk the year’s gains, with the S&P 500 falling -4.2% during the month. But there are reasons to be optimistic for a summer rally…
Comparing Nvidia to Dotcom Bubble
By: Paul Schatz, Heritage Capital LLC
Published: 6.10.24

In Paul’s latest video he compares Nvidia’s exponential run higher to the late 1990’s Dotcom bubble. Paul also looks at the election and how to read the Fed…
Indicators Remain Positive, But…
By: Ryan C. Redfern ShadowRidge Asset Management
Published: 5.31.24

Our Shadowridge Long-Term Trend indicator is still holding on to the positive reading it has held through the entire month of May. Last month looked like the sell-off had stabilized, and that indeed was the case. However, it is now getting close to testing its own positive trend again.
The Message From the NAAIM Indicator Wall
By: National Association of Active Investment Managers
The NAAIM Indicator Wall provides a weekly update to a robust array of stock market indicators. The “wall” includes readings and explanations of indicators and/or models in the areas of price/trend, momentum, key price levels, overbought/sold readings, sentiment, monetary, economic, inflation, and market cycles.
This time, we’re featuring the Early Warning Board , which is designed to suggest when the market may be ripe for a reversal on a short-term basis.

Note: The Indicator Wall is a benefit provided to NAAIM Members and is password protected. To obtain a temporary password, contact NAAIM at 888-261-0787.
All About Rates
By: Rob Bernstein, RGB Capital Group
Published: 6.10.24

Interest rates continue to influence stock market performance. Indications that the Federal Reserve may begin reducing
rates typically drive stock prices higher, whereas news suggesting prolonged higher rates generally causes stock prices to
decline. Smaller-capitalization stocks are particularly sensitive to interest rates, contributing to the underperformance of small- and mid-cap stocks this year. At the June FOMC meeting…
Internals Deteriorating Rapidly
By: Craig Thompson, President Asset Solutions
Published: 6.7.24

The S&P 500 index reached an all-time high this week; however, market internals continue to flash warning signs. A handful of large-cap semiconductor stocks appear to be propping up the market, but they may be the last chips to fall. Here are some of the factors that concern me…
The NAAIM Dynamic Allocation Model
Designed to be a value-add benefit to membership, NAAIM offers a Dynamic Asset Allocation Model based on the NAAIM Indicator Wall of indicators and models. The overall objective of the model portfolio is to dynamically adapt to changing market environments and to keep equity exposure in line with conditions. The model targets a normalized allocation of 60% stocks and 40% Bonds.
Here is this week’s model allocation:
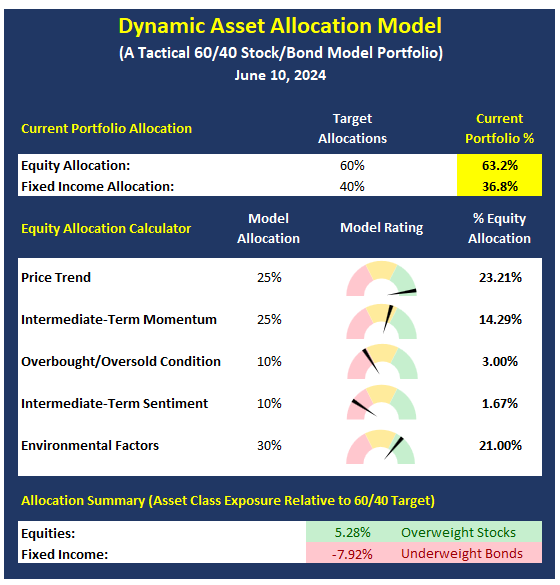
The model has been run live on the NAAIM website for several years and has demonstrated the ability to reduce exposure to market risk during negative environments such as those seen in 2015-16 and 2018.
More on the Dynamic Allocation Model and Historical Readings
The NAAIM Dynamic Allocation Model is for illustrative and informational purposes only, and does not in any way represent an endorsement by NAAIM or an investment recommendation.
Is Good News Good or Bad?
By: Bo Bills Bills Asset Management
Published: 6.7.24

Good news is bad and bad news is good! The thought being that the job
growth (good for the economy) will put the brakes on any rate cut talk by the Fed. Fed fund futures now indicate a
significant drop in expectations for Fed rate cuts in either July or September. However, after early morning weakness the
stock indices have recovered their losses and have moved into positive territory. In fact, we have seen this bullish pattern several times over the last couple of weeks…
Selling Picks and Shovels
By: Will Hepburn ShadowRidge Asset Management
Published: 5.31.24

There was a saying in the gold rush days that the people who made the most money were those that sold the picks and shovels to the miners. In that vein (see what I did there?), our newest Future Tech holding is a uranium mining company with earnings that are poised to increase dramatically over the next few years. If Microsoft’s nuclear plant is indeed the first of many to come, this stock may be in the sweet spot of the “picks and shovels” end of the AI revolution…
Where Are We Now?
By: Ben Reppond Reppond Investments
Published: 6.5.24

Ben Reppond’s latest video reviews the status of the stock market today…
Stock Spotlight: Churchill Downs
By: Asher Rogovy Magnifina
Published: 6.7.24

Home to 150 Years of Horse Racing History: Churchill Downs Incorporated (CHDN) is a racing, online wagering and gaming entertainment company. It owns and operates iconic assets such as the Kentucky Derby and Churchill Downs Racetrack, as well as casinos and historical horse racing facilities across multiple states. Churchill Downs continues to focus on creating unique entertainment experiences for its customers while driving profitable growth and building long-term shareholder value…
The NAAIM Member Exposure Index
The NAAIM Exposure Index represents the average exposure to US Equity markets as reported by our members in the organization’s weekly survey. Note that many NAAIM members are risk managers and tend to reduce exposure to the markets during high risk environments.
Click To See the Current Exposure Index
NOT INVESTMENT ADVICE. The analysis and information in this report and on our website is for informational purposes only. No part of the material presented in this report or on our websites is intended as an investment recommendation or investment advice. Neither the information nor any opinion expressed nor any Portfolio constitutes a solicitation to purchase or sell securities or any investment program. The opinions and forecasts expressed are those of the editors and may not actually come to pass. The opinions and viewpoints regarding the future of the markets should not be construed as recommendations of any specific security nor specific investment advice. Investors should always consult an investment professional before making any investment.
Tags: NAAIM, NAAIM Speaks, Stock market, Stock Market Analysis, stock market, David Moenning, Heritage Capital Research, Paul Schatz, Heritage Capital LLC, Rob Bernstein, RGB Capital Group, Ryan Redfern, Shadowridge Asset Management, Sam Bills, Bo Bills, Bills Asset Management, Dexter Lyons, Issachar Fund, Jim Lee, Stratfi, Craig Thompson, Asset Solutions, William Hepburn, Asher Rogovy, Magnifina, Ben Reppond, Reppond Investments, NAAIM Exposure Index, NAAIM Dynamic Allocation Model